Probability
The future is always involves some degree of uncertainty. The science of probability attempts to quantify the chances of events occurring in the future. People have spent entire lifetimes studying this fascinating and often misunderstood topic. Summarizing probability theory would be impossible to do in this format. However, it is critical for investors to understand some basic tenets of the subject.
Signals and Noise
All sets of data contain some element of randomness, or as statisticians call it, noise. The challenge when analyzing any data set is to eliminate what is really happening (signal) from randomness (noise). But we have to be careful. What appears to be a pattern in small data sets may turn out to be nothing more than noise when more data is analyzed. Therefore it is critical to always have a sufficient sample size of data to work with before attempting to draw any conclusions.
Suppose we measured the height of 100 people, chosen at random. One person in the group may be 5 feet tall and another may be 6 foot 6. However if we plot the distribution of these heights in something called a histogram, we notice a pattern.
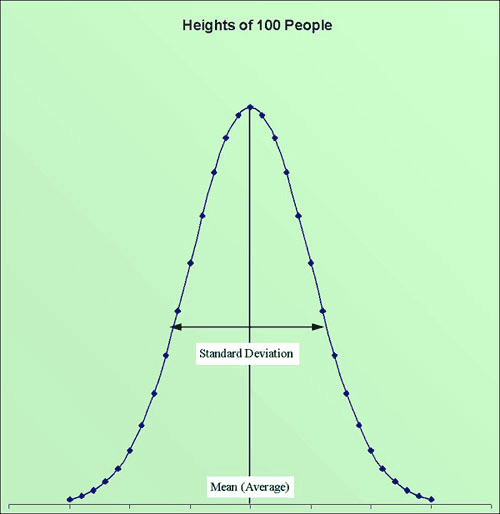
We can see that although these people were chosen at random, their collective heights follow some sort of pattern. If we had measured 1,000 or 10,000 or 1 million people instead of only 100, the pattern would become more and more prominent. We call this resulting pattern a Normal Distribution. We find this same pattern in many data sets in nature. If we know that a data set is normally distributed, we can completely describe the entire data set using only two variables:
Mean. The mean is simply the arithmetic average of the data set. All we need to do to calculate the mean is to add up all of the observations and divide by the number of observations.
Standard Deviation. The standard deviation of the data set is a more complicated calculation. However, in simple terms, this variable describes an average value of how far each observation strays from the mean. Data sets with large standard deviations have more variability amongst the individual observations. Data sets with small standard deviations have less variability amongst the individual observations.
What does this mean for investors?
When we analyze historical stock market data, we see that the individual annual returns of the stock market follow a somewhat normal probability distribution. As such, we can calculate a long-term mean and standard deviation from this data.
| Mean | 11%* |
|---|---|
| Standard Deviation | 20%* |
Some years investors may receive a +30% return on stocks, and some years they may receive a �15% return on stocks. However over long periods of time, investors can expect an 11% average return from the stock market.
Given the breadth of news coverage, it would be difficult not to notice fluctuations in stock prices. Many investors make their investment decisions based on these inevitable daily, weekly, and monthly gyrations. These short-term movements are simply random, unpredictable noise. They are not the signal. Intelligent investors focus solely on the only thing that is meaningful: the long-term signal. They realize that there exists an extremely high probability that stocks will achieve their long term average return of 11% over their investing lifetimes - if they stick with them through thick and thin.
*Source: Ibbotson's SBBI 1926-2008